QC Teams: Prove Batch-to-Batch Consistency with 3 Controls

Batch-to-batch consistency means every production run delivers the same critical attributes: identity, potency, purity, and impurity profile, within predefined limits. You prove it through three linked controls: validated analytical methods that measure the right attributes, statistical process control that separates normal noise from real drift, and longitudinal comparison of Certificates of Analysis across many lots rather than trust in any single report. The rest of this guide breaks down how to build that proof, lot by lot.
TL;DR:
Consistent batch-to-batch quality requires validated analytical methods, statistical process control, and long-term comparison of Certificates of Analysis.
Diagnosing variability sources involves checking raw materials, supplier changes, process drift, equipment, and operator sampling, often in combination.
Chromatographic fingerprinting with multivariate analysis offers a more reliable measure of quality than a single purity percentage.
Building an effective consistency program involves retaining all COAs, running trend analysis, and performing regular third-party spot checks.
Using suppliers that publish batch-level, third-party verified COAs simplifies verifying repeated quality across multiple lots.
Table of Contents
What Batch-to-Batch Consistency Really Means
Where Batch Variability Actually Comes From
The Analytical and Statistical Toolkit for Measuring Consistency
Process Controls That Actually Reduce Variation
A Protocol for Verifying Consistency Over Time
Regulatory Expectations for Batch Consistency
Why Consistency Determines Whether Results Are Trustworthy
Root Cause Analysis When a Batch Fails to Match
What Successful and Failed Consistency Programs Look Like
Balancing Throughput and Reproducibility
Choosing a Batch-Verified Peptide Supplier
Sources
FAQ
What Batch-to-Batch Consistency Really Means
Batch-to-batch consistency is a claim about a sequence of production runs, not a single one. A lot that passes release testing tells you that one batch met specification. It says nothing about whether the next ten will look the same on a chromatogram, and that gap is exactly where quality problems hide.
Reproducibility ties directly to three practical outcomes. Impurity control stays predictable only when the process that generates impurities behaves the same way every run. Stability data collected on one lot only transfers to future lots if the chemistry producing that lot didn’t shift. And downstream steps, whether that’s a pharmaceutical formulation step or a peptide purification cut, inherit whatever variability arrives from upstream.
Good Manufacturing Practice (GMP), as the FDA and EMA frame it, is fundamentally a reproducibility system, not a one-time inspection. A facility doesn’t earn GMP standing by making one clean batch. It earns that standing by demonstrating a validated process that reliably produces the same result, batch after batch, with documented controls at every step.
The business cost of getting this wrong is concrete:
Wasted raw materials and labor when an out-of-spec lot has to be scrapped or reworked.
Recall exposure when a variability issue surfaces after distribution rather than before release.
Failed downstream experiments when researchers can’t tell whether a result changed because of their variable or because of a shifted reagent lot.
Eroded customer confidence, which compounds fast in a market where buyers compare Certificates of Analysis across suppliers before ordering again.
None of these are abstract risks. They’re the direct, measurable consequence of treating a single passing COA as proof of a stable process, when it’s only proof of a stable moment.
Where Batch Variability Actually Comes From
Most batch inconsistency traces back to one of five sources, and diagnosing which one is active saves weeks of guesswork.
Starting materials and reagent lots. Raw material heterogeneity, especially in botanical inputs, is one of the most cited drivers of batch quality variability, since plant-derived material carries natural chemical variation that synthetic feedstocks don’t. Even in synthetic chemistry, a new reagent lot with a slightly different assay value or trace impurity profile can shift yield or purity without anyone changing a written procedure.
Supplier-side inconsistency. A vendor who changes their own upstream process, or blends lots without disclosure, passes that variability straight into your process. Weak supplier qualification is often the root cause investigators find after the fact.
Process drift specific to the chemistry. In solid-phase peptide synthesis, coupling efficiency at each residue compounds across the sequence, so a small drop in coupling yield at one step can produce a materially different impurity profile in the final peptide. Purification cut decisions, where the operator chooses which chromatographic fractions to pool, introduce another variable point that a rigid rule set controls better than judgment calls.
Equipment precision and maintenance. HPLC pump seals wear, columns degrade, balances drift out of calibration. None of these failures are dramatic on their own, but each one nudges a result away from the last batch’s baseline.
Operator and sampling variation. Two technicians who sample from different points in a mixing vessel, or who interpret a visual endpoint differently, generate data that looks like a process problem when it’s really a procedure problem. Lyophilization and drying steps deserve particular attention here, since moisture content and cake structure are sensitive to subtle timing and temperature differences that don’t always show up in a written SOP.
Most real-world investigations find more than one of these acting together. A supplier’s slightly off-spec reagent lot combined with a marginal coupling step is a common combination in peptide manufacturing, and neither cause alone would have pushed the batch out of range.
The Analytical and Statistical Toolkit for Measuring Consistency
You can’t manage batch consistency without measuring it first, and the measurement has to go deeper than a single purity percentage.
High-performance liquid chromatography (HPLC) remains the workhorse method, but the real information lives in the shape of the chromatogram, not just the headline number. Peak retention times, shoulder peaks, baseline drift, and the relative area of minor impurity peaks all carry information that a single purity figure discards. Mass spectrometry adds a confirmatory layer, verifying identity and catching mass shifts that indicate degradation or synthesis errors that HPLC alone might miss.
Chromatographic fingerprinting takes this further by treating the entire chromatogram, not just the target peak, as the object of comparison. A peer-reviewed evaluation of botanical drug products demonstrated exactly this approach, pairing HPLC chromatographic fingerprinting with multivariate statistical analysis to assess whether successive batches held consistent quality despite natural raw-material variation. The method and chemometric literature behind this approach, described in detail in established chromatographic fingerprinting and chemometrics references, gives QC teams a validated framework rather than an improvised one.
Statistical tools that turn raw data into evidence:
Statistical process control (SPC) and control charts plot key attributes, purity, yield, residual solvent level, across successive batches, flagging when a value falls outside expected common-cause variation.
Process capability indices (Cp, Cpk) quantify how much margin exists between your process’s natural spread and your specification limits, which tells you whether a process is robust or merely lucky.
Principal component analysis (PCA) and cluster analysis applied to fingerprint data can detect subtle drift across complex mixtures where a single-number purity value hides the change entirely. This matters most for botanical extracts and peptide blends, where dozens of minor components shift together in ways no single metric captures.
Trend analysis across retained COAs converts a stack of individual lot reports into a longitudinal dataset, the only format that actually answers the batch-to-batch question.
Pro Tip: Pull the raw peak-area data from every COA into a shared spreadsheet or statistical package the moment you receive it. A pile of PDF certificates tells you nothing until the numbers inside them are lined up side by side.
A working number worth internalizing: analytical method validation guidance emphasizes that proper sampling and preprocessing steps directly affect whether a chromatographic comparison detects real variability or just method noise. Skip validation on your comparison method, and you risk chasing phantom drift or missing real drift entirely.
Designing the sampling plan matters as much as running the assay. Acceptance criteria should be set wide enough to tolerate normal common-cause variation but tight enough to flag the assignable causes, a bad reagent lot, a drifted instrument, that actually threaten product quality. Getting that boundary wrong in either direction either buries you in false alarms or lets real problems slide through undetected.
Process Controls That Actually Reduce Variation
Measurement tells you where you stand. Process control is what moves the needle.
Start with method validation and change control discipline. A validated analytical method locked to specific parameters, column type, mobile phase composition, flow rate, gives you a stable measurement baseline. Without that lock, you can’t tell whether a chromatogram shift reflects a real process change or just a different day’s method conditions. Any deviation from the validated method should trigger formal documentation before it’s adopted, not after.
Supplier qualification deserves the same rigor you apply internally. Incoming-material testing on every reagent lot, not just the first shipment from a new vendor, catches drift before it enters your process. Retain supplier COA history the same way you retain your own, because a vendor’s gradual quality slide often shows up in their paperwork trend before it shows up in your finished product.
Concrete interventions that shrink run-to-run variation, ranked roughly by effort-to-payoff ratio:
Qualify equipment on a fixed preventive maintenance schedule, not a reactive one triggered by failure.
Automate steps with high human-judgment sensitivity, such as fraction pooling during purification, wherever the chemistry allows it.
Standardize sampling location, timing, and handling across every operator and every shift.
Control environmental variables, humidity and temperature especially, around steps like lyophilization where they materially affect the outcome.
Harmonize operator training with a documented, tested competency check rather than a one-time walkthrough.
Build purification cuts and specification “test-for-outs” that tolerate small, expected upstream shifts instead of requiring perfection at every intermediate step.
That last point deserves emphasis: a process designed with some built-in tolerance to minor upstream variation is more resilient than one that demands flawless inputs at every stage. Rigid processes look precise on paper and break the first time a reagent lot varies by a percentage point.
Related reading on how storage conditions introduce their own variability after production: peptide stability, storage, and handling covers how cold chain gaps can undo consistency work done earlier in the process.
A Protocol for Verifying Consistency Over Time
A single Certificate of Analysis is a single data point. It tells you about one lot, on one day, tested by one method. Consistency is a property that only shows up across a sequence of those data points, which is why industry analysis of peptide manufacturing treats COA retention and cross-lot comparison as the actual proof mechanism, not the individual certificate.
Building that evidence base doesn’t require exotic tools, just discipline:
Retain every COA you receive, indefinitely, in a searchable format, not a folder of unopened PDFs.
Extract the key numeric fields, purity, major impurity levels, identity confirmation, into a running dataset the moment each COA arrives.
Run SPC control charts and, where you have fingerprint-level data, multivariate comparisons against the accumulated history rather than against a single prior lot.
Schedule third-party spot checks at fixed intervals, independent of whether anything looks wrong, since drift often precedes any visible red flag.
Document every supplier response to an anomaly you flag. A vendor’s investigation quality tells you as much about future reliability as the anomaly itself.
Interpreting a chromatogram difference takes judgment. A shifted retention time within a tight window, paired with an unchanged impurity profile, usually reflects normal method or column variation. A new peak, a growing shoulder on the main peak, or a shift in relative impurity area across several consecutive lots is a different signal entirely, one that warrants escalation before the next order ships. Our guide to reading peptide Certificates of Analysis walks through exactly which chromatogram elements deserve that closer look.
What you should demand from any supplier is straightforward: batch-level COAs for every lot, not a representative sample; transparent disclosure of the methods used to generate them; and third-party verification rather than in-house-only testing. A batch-level verification approach that publishes independent testing results for each individual lot gives you a real longitudinal record to build trend analysis on, instead of an occasional snapshot.
Regulatory Expectations for Batch Consistency
The FDA and EMA don’t treat batch-to-batch consistency as a nice-to-have. It’s structurally embedded in GMP requirements, which require validated manufacturing processes and documented change control specifically because a validated process is what makes reproducibility a design property rather than a hope.
For botanical and traditional-medicine products, the standardization challenge is sharper because raw material heterogeneity is built into the input. PAHO/WHO guidance on traditional medicines research and evaluation emphasizes standardized raw-material characterization and appropriate analytical evaluation precisely because botanical inputs vary by growing season, geography, and harvest timing in ways synthetic feedstocks don’t.
For laboratory research compounds, including peptides, no FDA approval pathway currently applies since these materials are sold for research use only, not for human or animal consumption. That distinction matters for how you should read supplier claims: a research-use-only peptide isn’t operating under an approved drug’s GMP framework, which makes independent, batch-level analytical verification even more important as a substitute for regulatory oversight that simply doesn’t apply to that category of product.
Regulatory guidance in both jurisdictions converges on the same underlying logic: consistency has to be demonstrated with data across multiple runs, documented change control, and validated methods, not asserted after the fact.
Why Consistency Determines Whether Results Are Trustworthy
Inconsistent batches don’t just create paperwork problems. They corrupt the science and the safety margin that depend on the material behaving the same way every time.
In a research setting, a peptide research compound with shifting purity or a different impurity profile from one order to the next introduces a confound that no experimental design can control for. A researcher who observes a different result between two experiments run months apart has no way to know whether that difference reflects their variable of interest or a quietly different reagent lot. That ambiguity is expensive: it can send a research program down a false lead or bury a real effect in noise.
Safety margins depend on the same reproducibility. An impurity that stays below threshold in nine batches and creeps above it in a tenth isn’t a rounding error, it’s a process that has drifted outside its validated boundary. Efficacy and safety data collected on one batch only generalizes to future production if that production stays inside the same envelope the original data was generated in.
This is exactly why chromatographic fingerprint comparison matters more than a single purity percentage. Two batches can report the same 98% purity figure while differing meaningfully in which 2% is missing, and that difference is what a full fingerprint comparison catches and a headline number hides.
Root Cause Analysis When a Batch Fails to Match
When a batch falls outside your established range, the investigation should move systematically rather than jumping straight to the most familiar suspect.
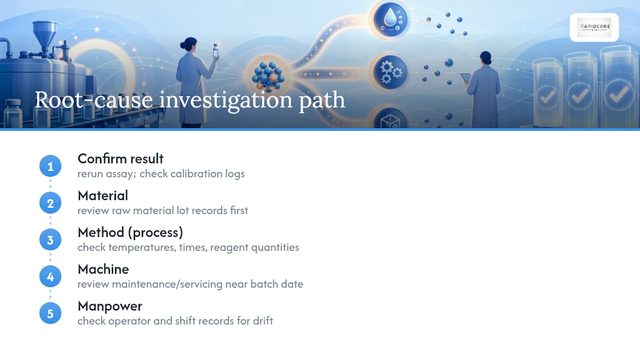
Start by confirming the analytical result itself. Rerun the assay, check instrument calibration logs, and rule out a testing artifact before assuming the batch itself is the problem. A meaningful share of apparent batch failures trace back to a drifted instrument or a sampling error rather than a real manufacturing deviation.
If the result holds, work backward through the process in the order material actually flows: raw material lot records first, since incoming-material variability is among the most common root causes; then process parameters at each unit operation, checking logged temperatures, times, and reagent quantities against the validated ranges; then equipment maintenance records for anything serviced or replaced near the batch date; and finally operator and shift records, since a change in personnel sometimes correlates with a change in outcome purely through subtle procedural drift.
A fishbone or Ishikawa-style breakdown, organizing potential causes into material, method, machine, and manpower categories, keeps an investigation from tunneling on the first plausible explanation. The goal isn’t to find an explanation that fits. It’s to find the one that’s actually supported by the timeline and the data.
What Successful and Failed Consistency Programs Look Like
The pattern that separates a well-controlled process from a chronically unstable one usually isn’t the sophistication of the equipment. It’s whether the team measures continuously or only when something already looks wrong.
A production line that adopts SPC control charts from day one, tracking purity and key impurity levels on every batch rather than reviewing data only during an investigation, tends to catch drift while it’s still a minor deviation instead of a failed lot. The chart shows a slow creep in one direction three or four batches before any single result crosses a specification limit, giving the team time to intervene through calibration or supplier follow-up before a batch has to be scrapped.
The common pitfall runs the opposite direction: teams that treat each COA as a pass or fail checkpoint and file it away, with no comparison against the accumulated history. In that setup, a slow six-month drift in impurity profile can go completely unnoticed because every individual batch technically passed its own specification. The failure isn’t in any single result. It’s in never comparing results to each other.
Another recurring pitfall shows up in supplier relationships that lack independent verification. A buyer who accepts a supplier’s own internal testing without third-party confirmation has no way to detect a supplier-side process change until it shows up as a customer complaint, which is a far more expensive discovery point than catching it in a routine spot check.
Balancing Throughput and Reproducibility
Every QC team eventually faces the same tension: production wants throughput, and consistency work takes time away from it. The right posture is measure first, then decide where to spend.
Quick wins, tightening supplier qualification, harmonizing how technicians sample, cost little and often close the biggest variability gaps fastest. Bigger investments, automation of judgment-heavy steps, full method redevelopment, take longer to pay back and deserve a data-backed case before you commit resources to them.
Don’t skip the measurement step to save time. A team that invests in automation before confirming where variability actually originates risks solving the wrong problem expensively. Consistency metrics work best as a shared responsibility across QC, production, and procurement, since the root causes rarely live in just one department, and the fix usually requires all three at the table.
— Adrian K. Solis
Choosing a Batch-Verified Peptide Supplier
Building an in-house program that catches every source of batch variability takes real investment: validated methods, retained COA history, scheduled third-party spot checks, and a team disciplined enough to keep running the comparisons. For researchers who need that confidence now, without building the whole verification pipeline themselves, working with a supplier that already publishes batch-level data shifts a meaningful part of that burden off your team.
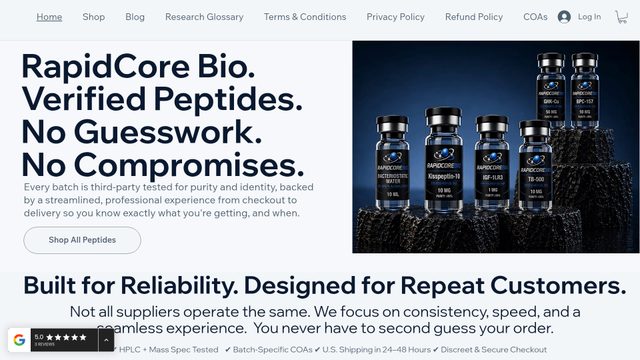
Some suppliers structure their offering around this need by providing each batch with its own Certificate of Analysis, verified through third-party testing rather than internal-only assays, so customers are not asked to take a single vendor’s word for identity or purity. That transparency matters most in the moment you’re evaluating a new research peptide source and need to compare documentation quality before committing to an order, and it matters again every time you reorder and want to confirm the new lot matches what you received last time.
If your work also depends on supporting supplies, bacteriostatic water and other handling materials are available alongside the peptide categories, so a lab doesn’t have to source verification-grade compounds from one vendor and handling supplies from another. Browse the research-grade peptide categories to see current batch documentation before placing your next order.
This article is general information, not a substitute for advice from a qualified doctor. Consult a qualified healthcare professional about your own circumstances before acting on anything here.
Sources
Chromatographic fingerprinting and chemometrics (method reference)
Analytical method validation and chromatographic analysis (methodology reference)
Batch-to-batch consistency — peptide manufacturing (industry analysis)
FAQ
What Is Batch-to-Batch Consistency?
Batch-to-batch consistency is the degree to which critical quality attributes, identity, purity, potency, and impurity profile, stay the same across successive production runs. It’s demonstrated through validated analytical testing, statistical process control, and comparison of Certificates of Analysis across multiple lots, not through a single passing test result.
Is It “2 Batch” or “2 Batches”?
The correct plural form is “batches.” “Batch” follows standard English pluralization, so two production runs are “two batches,” and the concept discussed throughout quality control literature is properly called batch-to-batch consistency, not “batch to batches.”
What Does “Batch” Mean in Manufacturing?
A batch is a defined quantity of material produced in a single manufacturing cycle under uniform conditions, intended to have consistent characteristics throughout. This is distinct from unrelated uses of “batch” in other fields, such as computational batch processing, which describes grouping data for processing rather than a physical production run.
What Is Batch Reconciliation?
Batch reconciliation is the process of accounting for all material inputs and outputs of a production run, confirming that expected yield, losses, and quantities match what the process should have produced. It’s a documentation control that supports batch-to-batch consistency by flagging unexplained material discrepancies before a batch is released.
How Can I Verify a Peptide Supplier’s Batch Consistency?
Request batch-specific Certificates of Analysis for multiple lots rather than one representative sample, and compare purity, chromatogram shape, and impurity peaks across them. Rapidcorebio provides third-party verified, batch-level COAs for its research peptides, giving researchers a documented trail to compare across orders instead of relying on a single certificate.
This article is intended for laboratory and research audiences. All peptides referenced are research compounds intended for laboratory use only and are not approved for human or animal consumption.
Recommended