635 Sample Peptide Stability Data: Match Datasets and Methods for Labs

Peptide stability data are time-course measurements of intact peptide under a defined matrix and condition set, typically expressed as half-life, percent intact over time, and identified degradants. The most reliable sources pair those numbers with explicit assay metadata rather than a bare percentage. Datasets like PepMSND, PEPlife, and the CRG proteotypic stability resource are the closest things researchers have to standardized references, but every one of them carries an important caveat: assay conditions and sample prep drive apparent stability as much as the peptide’s own chemistry does.
TL;DR:
Most peptide stability datasets lack detailed assay metadata, making it essential to match test conditions with your specific matrix and species.
Sample cleanup methods like acid precipitation can cause analyte loss, so organic solvents or solid-phase extraction often yield more reliable stability measurements.
Accelerated stability testing offers comparative insights but is unreliable for precise shelf-life prediction beyond initial formulation ranking.
Prediction models provide helpful prioritization but depend heavily on the quality of training data, which is often inconsistent or incomplete.
Proper reporting of stability data requires full transparency of experimental conditions, including matrix details, timepoints, and detection methods, to ensure reproducibility.
Table of Contents
What Do the Major Peptide Stability Datasets Actually Contain?
How Do You Design a Reproducible Stability Assay?
What Makes an Analytical Method “Stability-Indicating”?
Which Degradation Pathways Should You Watch For?
How Do You Prevent Sample Prep From Biasing Your Results?
Can You Trust Accelerated Stability Testing to Predict Shelf Life?
What Can Predictive Models Add to Your Stability Workflow?
How Should You Report Peptide Stability Data for Reuse?
How RapidCoreBio Supports Reliable Stability Research
Why Peptide Stability Data Still Has a Reproducibility Problem
Sources
FAQ
What Do the Major Peptide Stability Datasets Actually Contain?
Public peptide stability data lives across a handful of resources, and each one was built with a different question in mind. Knowing what each dataset measures, and what it leaves out, saves you from citing a number that doesn’t apply to your matrix.
PepMSND is currently one of the more ambitious efforts. It integrates multi-level feature engineering with a deep-learning model trained to predict blood stability, and it reports an AUC of approximately 0.912 on its evaluation set, a strong number by peptide-prediction standards. The underlying blood-stability database behind PepMSND catalogs 635 curated samples, split into 107 cyclic and 528 linear peptides, with subsets drawn from in vivo human, in vitro human, in vivo mouse, and in vitro mouse conditions. That same analysis found roughly 57 percent of entries classified as unstable in blood, and cyclic or otherwise modified peptides trended toward greater stability than linear ones.
PEPlife takes a different approach, functioning more as a curated repository of half-life values pulled from literature rather than a purpose-built modeling dataset. It’s useful for quick half-life lookups but tends to carry thinner metadata on assay conditions than PepMSND.
The CRG proteotypic stability resource focuses on peptides relevant to proteomics workflows, and its deep-learning model reported an AUC near 0.809 on a holdout set. That’s a meaningfully lower score than PepMSND’s, which reflects both a harder prediction task and a different definition of “stable.”
The gaps matter more than the headline metrics in most cases:
Many entries omit exact matrix composition (fresh vs. pooled plasma, species-specific enzyme activity).
Replicate counts are often unreported, making it hard to judge variance.
Sample preparation method (precipitation type, quench timing) is frequently absent or buried in supplementary files.
Detection method (fluorescent tag vs. isotopic label vs. label-free LC-MS) isn’t always specified, and it changes the numbers you get.
The practical rule: before you cite a half-life from any of these sources, match its matrix and species to your own experimental question. A mouse in vitro plasma half-life tells you very little about human in vivo behavior, and treating the two as interchangeable is one of the more common misreadings of this literature.
How Do You Design a Reproducible Stability Assay?
Generating your own peptide stability data instead of borrowing someone else’s is often the safer move, especially when your peptide, matrix, or formulation doesn’t match anything in the public datasets. The workflow breaks into three stages: incubation, cleanup, and detection. Get any one of them wrong and the resulting curve tells you more about your protocol than about the peptide.
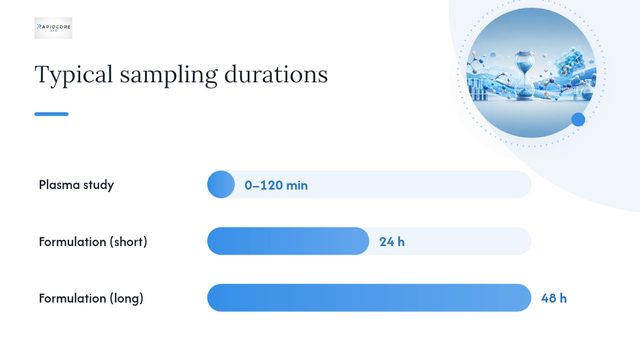
Incubation design. A defensible stability study samples enough timepoints to characterize the decay curve, not just an endpoint. A common design pulls aliquots at 0, 5, 15, 30, 60, and 120 minutes for plasma stability, extending to 24 or 48 hours for formulation stability at refrigerated or room temperature. Run the incubation at a controlled temperature (37°C for physiological matrices, whatever your intended storage temperature for formulation work) and always include a heat-inactivated or buffer-only negative control alongside a known unstable peptide as a positive control. Without a positive control, you can’t distinguish “my peptide is stable” from “my assay isn’t sensitive to degradation.”
Quench and cleanup. This is where a lot of stability data goes wrong before it ever reaches the mass spectrometer. Strong-acid precipitation (trichloroacetic acid, perchloric acid) has long been a default cleanup step for plasma protein removal, but a comparative protocol study found that acid precipitation causes significant analyte loss, understating how much peptide actually survived incubation. The same study found organic solvent precipitation (cold acetonitrile or methanol mixtures) and solid-phase extraction preserved more peptide for downstream analysis. If your stability numbers look worse than expected, check your cleanup step before you conclude the peptide itself is fragile.
Detection. LC-MS/MS is the workhorse for stability quantification, and pairing it with isotopically labeled internal standards is the most reliable way to correct for extraction losses and instrument drift. Fluorescent labeling is common in some plasma-stability protocols because it’s cheap and fast, but labeling chemistry changes molecular size and hydrophobicity, which can shift degradation kinetics relative to the unlabeled peptide. Laboratory researchers have specifically flagged that the enzymatic composition of the biological fluid and the choice of fluorescent versus isotopic labeling materially change measured degradation dynamics, so treat labeled-peptide half-lives as an approximation of the native compound’s behavior, not an exact match.
A reporting checklist worth keeping on your bench:
Exact matrix (species, tissue source, fresh vs. pooled, anticoagulant used).
Incubation temperature, timepoints, and total duration.
Quench method and cleanup protocol.
Detection method, including internal standard identity and labeling chemistry if used.
Replicate number and how variability was calculated.
Peptide concentration at time zero.
Pro Tip: Run your positive control peptide through the exact same cleanup and detection pipeline as your test peptide, in the same batch. If the positive control’s known half-life comes out close to the literature value, you can trust your test peptide’s number. If it doesn’t, the problem is your method, not your peptide.
What Makes an Analytical Method “Stability-Indicating”?
A method only earns the label “stability-indicating” (SIM) if it can separate, detect, and quantify degradants without those degradants co-eluting with or masking the parent peptide. RP-UPLC paired with LC-MS/MS is the standard combination for peptide SIMs, and it’s the approach recommended in most peptide-specific forced-degradation method playbooks. High-resolution MS adds real value here: an Agilent InfinityLab application note demonstrates that high-resolution MS improves impurity identification in GLP-1 receptor agonist stability work, resolving degradation products that lower-resolution instruments miss entirely.
Forced degradation is how you generate the degradants your method needs to prove it can catch. Typical stress conditions include:
Acidic and basic hydrolysis (low and high pH buffers, elevated temperature).
Oxidative stress (hydrogen peroxide or metal-catalyzed oxidation) to reveal Met, Trp, and Cys liabilities.
Thermal stress at elevated temperatures well above intended storage.
Photolytic exposure per ICH-aligned light conditions.
Elevated humidity for solid-state or lyophilized material.
Each stressor reveals a different failure mode, and running only one (heat, say) will miss oxidation-prone sequences entirely.
AUC as a benchmark: PepMSND’s reported AUC of 0.912 sits well above the CRG model’s roughly 0.809, but both numbers describe performance on their own curated holdout sets. A model AUC is not a substitute for validating your specific peptide experimentally; it’s a prioritization tool, discussed further below.
Once you have degraded material, validation of the SIM itself needs to cover specificity (can it resolve parent from degradant on stressed samples), accuracy and recovery, precision across replicates and days, limit of detection and quantification for both parent and impurities, and robustness to small method changes. A method that passes on freshly synthesized, undegraded peptide but has never been challenged with stressed material hasn’t actually been proven stability-indicating.
For peptides with closely related degradants (isoaspartate from aspartimide rearrangement, for instance), a single RP separation sometimes can’t resolve everything. Orthogonal separations, ion-exchange chromatography, phenyl-based reversed phase, or size-exclusion for aggregation, add confidence when RP-UPLC alone leaves ambiguous peaks.
Which Degradation Pathways Should You Watch For?
Most peptide instability traces back to a short list of chemical reactions, and knowing which sequence motifs trigger them lets you predict risk before you ever run an assay. A review of peptide stability and delivery strategies lays out the mechanistic landscape clearly, and it maps closely onto what shows up in LC-MS degradant profiles in practice.
Deamidation converts asparagine or glutamine to aspartate or glutamate, and it accelerates sharply when Asn is followed by Gly (an Asn-Gly motif is one of the more reliable red flags in a sequence).
Oxidation targets methionine, tryptophan, and cysteine side chains, and shows up as a mass shift of +16 Da (or multiples) on the MS trace.
Hydrolysis cleaves the peptide backbone, often at Asp-Pro or Asp-Gly bonds, generating smaller fragments detectable by their reduced mass.
Diketopiperazine (DKP) formation affects peptides with a proline or glycine near the N-terminus, cyclizing the first two residues and clipping the rest of the chain.
Aspartimide formation occurs at Asp-Gly or Asp-Ser sequences under basic or elevated-pH conditions, often followed by isoaspartate rearrangement.
Disulfide scrambling disrupts cysteine-containing peptides when free thiols or trace metals catalyze incorrect pairing.
Aggregation tends to show up in peptides with high beta-sheet propensity or lipidation, and it’s often invisible to standard RP-UPLC unless you add SEC.
Binding to serum proteins, particularly albumin, is a separate variable that inflates apparent blood stability independent of the peptide’s intrinsic chemical resistance. Lipidated peptides bind albumin far more strongly than unmodified ones, and that binding can protect the peptide from proteolytic attack simply by sequestering it away from circulating enzymes. This is part of why reported plasma half-lives across model peptides vary so widely, from a few minutes for small unmodified linear peptides to many hours for lipidated or cyclic analogs. A number without its binding context is only half the story.
How Do You Prevent Sample Prep From Biasing Your Results?
The single biggest source of nonreproducible stability data isn’t the peptide’s chemistry. It’s what happens to the sample before it ever reaches the instrument.
Adsorption to labware is the quiet failure mode. Peptides, especially hydrophobic or low-concentration ones, stick to polypropylene and glass surfaces, and that loss looks identical to degradation on a standard curve. Documentation on this problem recommends low-binding tubes, surface pre-conditioning with a carrier protein, or a sacrificial peptide blocker to keep your target peptide in solution rather than on the tube wall.

Acid precipitation deserves a second mention here because it’s still a default step in many legacy protocols. The same comparative protocol work cited earlier found meaningful analyte loss with strong-acid cleanup, and recommends organic solvent precipitation or SPE as the more faithful alternative, validated against isotopically labeled internal standards to confirm recovery.
Headspace oxygen matters more than most researchers assume for oxidation-prone peptides. Nitrogen overlay during storage and testing, along with oxygen scavengers in the container closure, reduces oxidative artifacts that would otherwise be misread as intrinsic instability.
Batch handling rounds out the list. Running all timepoints for a given condition from a single thawed aliquot, rather than pulling fresh aliquots repeatedly, removes a freeze-thaw variable that otherwise muddies the degradation curve.
Pro Tip: If two labs report wildly different half-lives for what looks like the same peptide and matrix, check the cleanup step first. Acid precipitation versus organic solvent precipitation alone can explain a two- to threefold apparent difference in recovered peptide.
Careful storage and cold-chain handling before the assay even starts prevents a lot of this bias from entering your data in the first place.
Can You Trust Accelerated Stability Testing to Predict Shelf Life?
Accelerated stability testing is useful for ranking formulations quickly, but it has real limits when you try to extrapolate it into a long-term shelf-life claim. The logic rests on the Arrhenius relationship: raise the temperature, speed up the reaction, and use the rate constants at elevated temperatures to project behavior at your intended storage condition.
The practical steps look like this:
Incubate the peptide at two or more elevated temperatures (commonly 25°C, 40°C, and 50°C) and measure percent intact at multiple timepoints for each.
Fit a degradation rate constant (k) at each temperature, typically assuming first-order kinetics for the dominant pathway.
Plot ln(k) against 1/T (an Arrhenius plot) to estimate the activation energy and extrapolate k at your intended storage temperature.
Use that extrapolated k to calculate t90, the time to 10 percent loss, at storage conditions.
The Agilent application note on peptide drug stability reinforces a point worth repeating: accelerated data reveals degradation pathways and ranks formulations reliably, but it requires careful interpretation before it supports a firm long-term claim. The Arrhenius model assumes a single dominant degradation mechanism across the whole temperature range tested. Peptides frequently violate that assumption; deamidation might dominate at one temperature while aggregation takes over at another, and a straight-line Arrhenius fit across both will misrepresent the real-world rate.
A commonly cited rule of thumb, the Q10 approximation, assumes reaction rate roughly doubles for every 10°C increase. It’s a useful sanity check for planning study duration, not a substitute for an actual multi-temperature kinetic fit.
Accelerated data is strong evidence for comparing formulations against each other under matched stress. It is weak evidence, on its own, for a specific shelf-life number at refrigerated storage, particularly beyond a year or two of projected duration.
What Can Predictive Models Add to Your Stability Workflow?
Computational prediction has moved from a novelty to a genuinely useful triage tool, mainly because the underlying training data has grown large enough to support it. PepMSND’s multi-level feature engineering approach reports an AUC around 0.912 for blood stability classification, built on curated experimental profiles spanning cyclic and linear peptides across human and mouse, in vivo and in vitro conditions. The CRG proteotypic stability model, trained on a different peptide population relevant to proteomics, reported an AUC near 0.809 on its own holdout set.
The sensible workflow looks like this:
Use a prediction model to rank a candidate sequence list by relative stability risk before committing bench time to any of them.
Validate the top candidates experimentally under conditions matched to your actual application, not the model’s training conditions.
Treat a model’s score as a prioritization signal, never as a stand-in for measured half-life in a report or publication.
The limitations are worth stating plainly. Training data across these models is heterogeneous, pooled from different labs, matrices, and detection methods, which introduces noise the model can’t fully separate from real biological signal. Most models also have length and modification constraints; a heavily modified or unusually long peptide may sit outside the training distribution entirely, and the reported AUC won’t apply to it. And because these models depend on the metadata quality of their source database, gaps in matrix or replicate reporting upstream propagate directly into prediction confidence downstream. An ACS Analytical Chemistry viewpoint on proteotypic peptide stability makes the same point from a slightly different angle: better predictive modeling depends on better-standardized experimental reporting, not just bigger neural networks.
How Should You Report Peptide Stability Data for Reuse?
Data that can’t be compared across labs is data that gets re-generated from scratch, which wastes time and reagent for everyone downstream. A minimal metadata set makes the difference between a reusable dataset entry and a number nobody can verify.
Full peptide sequence, including any non-natural residues or modifications.
Exact matrix (species, tissue, fresh vs. pooled, anticoagulant, or formulation buffer composition).
Starting concentration, incubation temperature, and full timepoint list.
Sample preparation and cleanup method, including quench timing.
Analytical method and key parameters (column, gradient, MS acquisition mode).
Internal standard identity and labeling chemistry.
Replicate count and how variability (standard deviation or confidence interval) was calculated.
Report half-life alongside the full time-course, not as an isolated number, and include percent intact at each timepoint with its confidence interval where replicates allow it. Depositing raw chromatograms and MS spectra alongside processed data, in open formats where possible, keeps the dataset useful to future modelers as well as bench researchers.
Reporting element | Minimum standard |
Sequence and modifications | Full sequence, all non-natural residues noted |
Matrix | Species, tissue source, prep (fresh/pooled) |
Timepoints | At least 4 points spanning expected half-life |
Replicates | 3 or more, with variability reported |
Internal standard | Identity and labeling chemistry stated |
A consistent naming convention (peptide ID, matrix, temperature, replicate number) in file names alone eliminates a surprising share of the confusion that plagues shared stability datasets.
How RapidCoreBio Supports Reliable Stability Research
Every batch RapidCoreBio distributes ships with a certificate of analysis backed by third-party verification, confirming identity and purity through HPLC and mass spectrometry before it ever reaches your bench. That analytical baseline matters directly for stability work: knowing your starting material’s purity and identity removes one variable from your degradation curve before you even begin the incubation.
We also maintain a growing library of research posts covering cold-chain handling, isotopic labeling approaches, and peptide shelf-life drivers, written for the same audience running these assays. A vendor-provided COA and analytical trace won’t replace your own in-house stability study, but it gives you a documented starting point instead of an unknown. That combination, verified starting material plus your own matched-condition testing, is what turns a single stability number into data you can actually defend.
Peptides discussed on this site, including research compounds like tirzepatide and the triple-receptor agonist retatrutide, are sold strictly for laboratory research use and are not intended for human or animal consumption.
Why Peptide Stability Data Still Has a Reproducibility Problem
The field has plenty of models now and not nearly enough standardized inputs to feed them. That’s the uncomfortable truth underneath the AUC numbers everyone cites. A 0.912 AUC sounds authoritative until you realize the training data behind it was pooled from studies that didn’t all report the same matrix details, replicate counts, or labeling chemistry. The models are only as good as the metadata discipline of the labs that generated their training sets, and right now that discipline is inconsistent at best.
The fix isn’t more sophisticated modeling. It’s boring, and it’s overdue: standardized metadata reporting, inter-lab ring trials to establish reference values for common model peptides, and a default expectation that isotopic internal standards accompany any published half-life. Pair that with orthogonal analytics, RP-UPLC plus SEC or IEX where aggregation or isoaspartate formation is plausible, and the field stops re-litigating the same acid-precipitation-versus-organic-solvent debate every few years. Depositing full annotated time-course data, not just a summary half-life, alongside every method parameter would do more for this field’s credibility than another incremental point of AUC.
— Adrian K. Solis
Sources
Peptide blood stability database and the PepMSND model (RSC publication)
Comparison of Protocols to Test Peptide Stability in Blood Plasma and Cell Culture Supernatants
Peptide stability & forced degradation playbook — BiologicsGuide
Peptide drug stability analysis using Agilent InfinityLab LC/MSD (application note)
FAQ
What is the typical shelf life of a peptide?
Shelf life varies by sequence, formulation, and storage temperature, with lyophilized peptides generally far more stable than reconstituted solutions; forced-degradation and accelerated stability studies are the standard tools for estimating a defensible shelf-life range for a specific peptide and matrix.
Do peptides really degrade after about 30 days?
Some do and some don’t. Degradation timing depends on the specific pathway at play, deamidation-prone or oxidation-prone sequences can show measurable loss well before 30 days in solution, while stable, properly stored lyophilized peptides often remain intact far longer.
How do you know when a peptide has degraded?
The definitive method is a validated stability-indicating LC-MS/MS assay that resolves and identifies degradants against a parent-peptide reference; visible cloudiness or precipitation can suggest aggregation, but chemical degradation like deamidation or oxidation is invisible without instrumental analysis.
This article is intended for laboratory and research use only. RapidCoreBio’s products are sold exclusively for research purposes and are not approved for human or animal consumption.
Recommended