Use ε205, Not 280 nm: Sequence Based Peptide UV Absorbance and Matched
Choose your wavelength by sequence composition, not habit. If your peptide contains tryptophan or tyrosine, calculate ε280 from residue counts and read at 280 nm. If it lacks aromatics, use a sequence-specific ε205 with matched blanks and solvent control instead of a generic constant. If you’re detecting peaks off a chromatography column, use 214 nm because the mobile-phase background makes 205 nm unreliable there.
TL;DR:
Use 280 nm for aromatic-rich peptides and calculate molar extinction coefficients based on tryptophan, tyrosine, and cystine content for accurate quantification.
For nonaromatic peptides, rely on 205 nm with sequence-specific ε205 values to account for backbone absorption, ensuring more precise concentration measurements.
When peptides elute off chromatography columns, measure at 214 nm to avoid solvent interference that diminishes the reliability of 205 nm readings.
Always perform full spectral scans, confirm linearity with dilution series, and match blanks to your buffer to improve reproducibility and accuracy of UV-based peptide quantification.
Verify peptide composition through batch-specific Certificates of Analysis when sourcing to ensure UV readings reflect the actual sample content.
Table of Contents
Peptide UV Absorbance: The Chromophores Behind the Spectrum
A280 vs A205 vs A214: Choosing the Right Method
Calculating a Sequence-Specific ε205 for Your Peptide
Buffer Interference and the Matched-Blank Protocol
Pathlength, Microvolume Instruments, and Reference Standards
When UV Absorbance Signals Structure, Not Concentration
Reading a Peptide COA Before You Trust the Absorbance Number
What Reproducible UV Quantification Actually Requires
Sourcing Research-Grade Peptides With Verified Analytical Data
Sources
FAQ
Peptide UV Absorbance: The Chromophores Behind the Spectrum
Peptide UV absorbance comes from two distinct electronic sources, and knowing which one you’re measuring changes everything about how you interpret your data. The peptide bond itself, the amide linkage repeated down the backbone of every peptide, absorbs deep in the ultraviolet range through both n→π* and π→π* electronic transitions. These backbone transitions peak somewhere between 190 and 220 nm, with the strongest signal typically landing near 205 nm. Anthis and Clore report an average peptide-bond molar extinction coefficient of roughly 2,780 M⁻¹cm⁻¹ per bond, and that number scales predictably with chain length. Earlier work on synthetic peptides lacking aromatic residues found that absorbance at 200 nm rises in direct proportion to the number of peptide bonds in the chain, which is exactly what you’d expect if the backbone amide is doing most of the work.
The second chromophore group lives in the side chains, specifically the aromatic residues. Tryptophan absorbs most strongly around 280 nm and dominates that region because its indole ring has a far higher molar extinction coefficient than either tyrosine’s phenol ring or phenylalanine’s simple benzene ring. Tyrosine contributes meaningfully but at roughly a quarter of tryptophan’s intensity, and phenylalanine barely registers unless it’s present in unusually high copy number.
A peptide’s A205/A280 ratio tells you something structural before you’ve run a single other test:
A high A205, low A280 ratio signals a peptide dominated by backbone absorbance, meaning it’s likely aromatic-poor and a candidate for sequence-specific ε205 quantification.
A strong A280 peak confirms tryptophan or tyrosine content and makes classic 280 nm quantification viable.
Unexpected shoulders or shifts near 280 nm can indicate tyrosine ionization, oxidation, or a formulation additive rather than a real concentration change.
Cysteine residues also matter here. Cystine (the oxidized, disulfide-bonded form) contributes a small but measurable absorbance near 250 nm, which is one more reason a spectrum, not a single reading, gives you the fuller picture.
A280 vs A205 vs A214: Choosing the Right Method
Three wavelengths dominate peptide UV absorbance work, and each one solves a different practical problem.
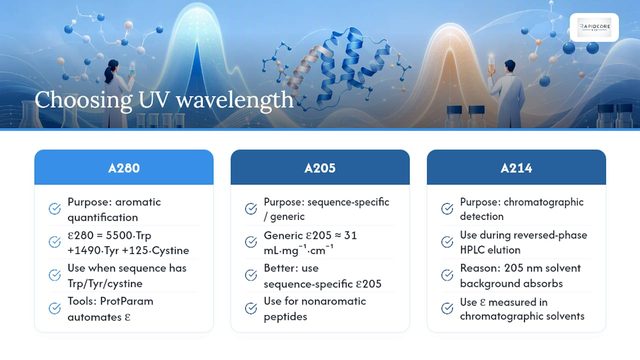
A280 (aromatic quantification). This is the classic approach, and it’s still the right default when your peptide contains tryptophan, tyrosine, or cystine. The extinction coefficient is calculated from a simple additive model: ε280 = (number of Trp × 5,500) + (number of Tyr × 1,490) + (number of cystine × 125), expressed in M⁻¹cm⁻¹. Tools like ProtParam automate this calculation from a pasted sequence, which is convenient for routine work. The limitation is obvious once you say it out loud: a peptide with zero aromatic residues gives you essentially nothing to read at 280 nm, no matter how concentrated your solution actually is.
A205 (sequence-specific or generic). For nonaromatic peptides, deep-UV absorbance at 205 nm becomes the workhorse wavelength. A widely cited generic rule of thumb treats ε205 as roughly 31 mL·mg⁻¹·cm⁻¹ for peptides and proteins in general, and that constant works reasonably well for a fast estimate. But it averages across amino acid composition, and peptides vary a lot in backbone-to-side-chain ratio. A sequence-specific ε205, calculated from your exact residue composition, corrects for that variability and is the more defensible choice whenever your sequence is known.
A214 (chromatographic detection). When you’re quantifying peptides eluting off a reversed-phase HPLC column, 214 nm becomes the practical choice, not because it’s inherently better, but because mobile-phase components (acetonitrile, formic acid, TFA) create background absorbance at 205 nm that swamps the peptide signal. Molar extinction coefficients measured specifically at 214 nm in chromatographic solvents let you quantify peaks as they come off the column without fighting solvent interference.
The underlying math for all three methods is Beer-Lambert: A = εcl, where A is absorbance, ε is the molar extinction coefficient, c is concentration, and l is pathlength in centimeters. Rearranged, c = A / (ε × l). Every quantification error you’ll ever chase traces back to one of these three variables being wrong or misapplied.
A sound workflow looks like this: run a full spectral scan (not a single-wavelength snapshot), confirm the response is linear across a dilution series, then report concentration alongside the ε value you used, the pathlength, and the blank composition.
Pro Tip: Never report a bare concentration number without stating which ε you used and whether it was sequence-specific or the generic 31 mL·mg⁻¹·cm⁻¹ estimate. Two labs using different assumptions on the same peptide can land 15 to 20 percent apart, and neither one is technically “wrong” without that context.
Calculating a Sequence-Specific ε205 for Your Peptide
The Anthis and Clore method treats ε205 as additive: total ε205 equals the backbone contribution plus the sum of side-chain contributions from every residue in the sequence. Conceptually, it looks like this:
Count the peptide bonds. For a linear peptide, that’s typically the number of residues minus one; for a cyclic or head-to-tail peptide, count the extra bond explicitly, because omitting it systematically underestimates ε205.
Apply the average backbone coefficient. Multiply the bond count by the reported average peptide-bond εbb (approximately 2,780 M⁻¹cm⁻¹ per bond).
Add residue-specific side-chain terms. Each amino acid, aromatic or not, contributes a measured increment at 205 nm; sum these across the full sequence.
Adjust for special chemistry. Disulfide-bonded (oxidized) cysteines absorb differently than free thiols, and this shift needs to be reflected in the final ε205 if your peptide is cyclized through a disulfide.
Flag noncanonical residues. D-amino acids, methylated residues, or synthetic non-natural side chains won’t have a validated coefficient in the standard tables, so treat those peptides as candidates for empirical calibration rather than pure calculation.
Anthis and Clore also provide a web-based tool that runs this calculation directly from a pasted sequence, which removes most of the manual bookkeeping.
Validation matters as much as the calculation itself. Run a dilution series and confirm the absorbance response stays linear across your working range; nonlinearity at higher concentrations often signals aggregation or instrument saturation rather than a bad ε value. Where the assay is critical (a key comparison, a published dataset, a reference standard), cross-check the UV-derived concentration against an orthogonal method like amino acid analysis or an HPLC-based assay calibrated against a weighed powder standard. Terminal modifications, such as acetylation or amidation, generally have a small effect on ε205 but should be accounted for if you’re chasing tight precision.
Buffer Interference and the Matched-Blank Protocol
Deep-UV wavelengths are exquisitely sensitive to more than just your peptide. Several common lab reagents absorb strongly enough at 205 to 214 nm to distort your reading if you’re not controlling for them. Tris buffer, HEPES, DTT, beta-mercaptoethanol, and certain detergents and organic modifiers all contribute background absorbance in this range, and the same paper that validated sequence-specific ε205 flags buffer and solute interference as a primary source of error at 205 nm.
The fix is a matched-blank protocol, and it’s not optional at these wavelengths:
Prepare your blank in the identical solvent and buffer your peptide sample is dissolved in, not a generic water blank.
Run a buffer-only scan across the full wavelength range before you ever measure the sample, so you know exactly what background you’re subtracting.
Subtract that blank from every sample reading, then re-check linearity across your dilution series to confirm the correction actually holds up at different concentrations.
For A205 work, water, phosphate-buffered saline, and other low-UV-interference ionic solutions are the safer solvent choices. For LC-based workflows, stick with 214 nm and mobile phases you’ve already validated as compatible, since that’s the entire reason chromatographers favor that wavelength in the first place.
Pro Tip: If your peptide sample and your blank don’t produce visually overlapping baselines above 250 nm, something in your buffer is contributing more deep-UV signal than you think. Re-scan before you trust the concentration number.
Pathlength, Microvolume Instruments, and Reference Standards
Beer-Lambert’s law means absorbance scales directly with pathlength, so a measurement error in pathlength translates directly into a concentration error of the same magnitude. Microvolume spectrophotometers, which use very short pathlengths (often under 1 mm) to measure small sample volumes without dilution, are convenient but demand more rigorous calibration than a standard 1 cm cuvette. Stray light and detector linearity become bigger concerns at deep-UV wavelengths, where signal-to-noise is already tighter than at 280 nm.
NIST developed SRM 2082 specifically as a pathlength standard for ultraviolet measurements, and it’s the appropriate reference for verifying that a microvolume or short-path instrument is reporting pathlength accurately. Alongside it, RM 8671 (NISTmAb) serves as a protein reference material that labs can use to benchmark their overall concentration-measurement procedure end to end, not just the pathlength component. Running either standard periodically, and always alongside a dilution-series linearity check, catches instrument drift before it quietly corrupts a dataset.
When UV Absorbance Signals Structure, Not Concentration
A rising or shifting absorbance reading doesn’t always mean your peptide got more concentrated. Aggregation and light scattering both distort UV spectra, often by lifting the baseline across a broad range rather than producing a clean peak, and a single-wavelength reading can’t distinguish that from a real concentration increase. A 2020 study on α-synuclein UV absorption spectra used both the peptide-bond region and the aromatic region together, tracked across time, pH, and aggregation state, specifically because interpreting either region in isolation missed what was actually happening to the protein.
pH and redox conditions shift spectra too. Tyrosine ionizes to tyrosinate at high pH, producing a genuine spectral shift near 295 nm that has nothing to do with concentration. Oxidation state changes in cysteine, and other chemical modifications, can likewise alter the effective ε without changing how much peptide is actually in solution.
When a reading looks off, don’t trust it in isolation. Cross-check with dynamic light scattering or size-exclusion chromatography for aggregation, circular dichroism for structural shifts, or fluorescence for tryptophan-specific behavior, and always re-run the dilution-linearity check first.
Reading a Peptide COA Before You Trust the Absorbance Number
A Certificate of Analysis tells you what’s actually in the vial before you ever put it in a cuvette, and that context changes how you interpret an unexpected reading. Purity and identity confirmed by HPLC and mass spectrometry, counterion or salt form, and any batch-specific notes all directly affect the ε you should use and the absorbance you should expect. If a peptide’s free-thiol versus disulfide state, or its exact salt form, isn’t specified, that’s worth asking your supplier before you finalize a quantification protocol. RapidCoreBio publishes batch-specific COAs library with HPLC and mass spectrometry verification, and researchers planning UV-based quantification can request additional detail directly when the standard COA leaves a variable, like counterion identity, unresolved.
What Reproducible UV Quantification Actually Requires
Reproducibility comes down to habits, not equipment. Always run a full spectral scan instead of a single wavelength, always match your blank to your exact solvent, and always confirm linearity across a dilution series before trusting a number. Skip orthogonal validation only when the stakes are genuinely low. When you publish, state your ε source, pathlength, instrument model, buffer composition, and validation method explicitly, because that’s the information other labs need to reproduce, or challenge, your result.
— Adrian K. Solis
Sourcing Research-Grade Peptides With Verified Analytical Data
Accurate UV quantification starts with knowing exactly what’s in your sample, and that’s where sourcing matters as much as your protocol. Some suppliers publish batch-specific COAs with HPLC and mass spectrometry verification for their products, providing compositional detail, purity, and identity confirmation helpful before calculating an ε205 or ε280 value with confidence.
If your work depends on knowing exactly what’s in the vial, browse Research Peptides for third-party-verified compounds, or check the Peptide Certificate of Analysis Guide to see what a complete COA should include before you trust an absorbance reading tied to it. When a salt form or counterion detail isn’t listed, reach out and ask; a supplier that publishes verification data should be able to answer that question directly. All products are sold strictly for laboratory research use.
Sources
Sequence-specific determination of protein and peptide concentrations by absorbance at 205 nm
Quantify protein and peptide preparations at 205 nm (Thermo Scientific NanoDrop application note)
FAQ
At what wavelength do peptides absorb UV light?
Peptides absorb primarily in two regions: the peptide backbone absorbs between roughly 190 and 220 nm (strongest near 205 nm), and aromatic side chains, tryptophan and tyrosine especially, absorb near 280 nm. Which region matters most for your quantification depends entirely on whether your sequence contains those aromatic residues.
Do all proteins and peptides absorb at 280 nm?
No. A280 quantification only works reliably when the sequence contains tryptophan, tyrosine, or cystine, since those are the residues generating signal at that wavelength. A peptide lacking all three will show minimal absorbance at 280 nm regardless of concentration, which is exactly why sequence-specific A205 methods exist.
Why do amino acids absorb UV light in the first place?
Amino acids and the peptide bond absorb UV light because their electrons undergo n→π* and π→π* transitions when they absorb photons of the right energy. Aromatic side chains have additional conjugated ring systems that create strong, distinct absorbance peaks near 280 nm on top of the backbone’s deep-UV signal.
How fast does UV absorbance change once a peptide is in solution?
Absorbance readings themselves are near-instantaneous once light passes through the sample, but the peptide’s actual spectral behavior can shift over time due to aggregation, pH-driven tyrosine ionization, or oxidation. That’s one reason a single spot reading is less reliable than a full scan paired with a dilution-linearity check.
Should I trust a supplier’s stated peptide concentration without verifying it myself?
A Certificate of Analysis showing HPLC and mass spectrometry verification gives you a strong starting point, but independent UV quantification, using the correct wavelength for your peptide’s composition, remains good laboratory practice. Rapidcorebio publishes batch-specific COAs so researchers can cross-check purity and identity data against their own analytical results.
Recommended