6 Step Peptide Concentration Determination Checklist for MS Labs
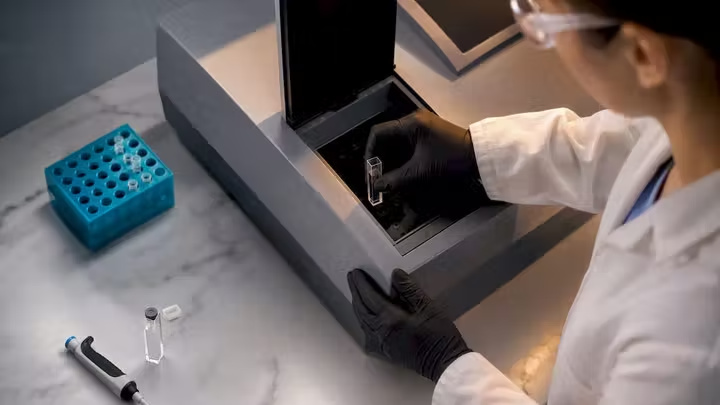
For quick QC on a single-peptide stock, A205/A214 or the Waddell A215–A225 formula gets you a reliable number in minutes. For MS-ready mixtures headed into a mass spectrometer, a microfluidic spectrophotometer paired with MS-peptide Quant software gives accurate, low-volume readings. When you need an absolute reference value, amino acid analysis or qNMR is the standard to confirm against, especially before you set a working stock concentration for downstream assays.
TL;DR:
Accurate peptide quantification requires adjusting for net peptide content rather than relying solely on vial weight, which includes impurities and moisture.
Far-UV methods like A205–A225 are versatile for most peptides but are sensitive to buffer interference, unlike sequence-specific A280 measurement that needs aromatic residues.
When preparing samples for MS analysis, microfluidic spectrophotometers paired with MS-peptide Quant software provide reliable, low-volume, MS-ready concentration readings.
Confirm results through amino acid analysis or qNMR, especially when discrepancies arise from UV or UV-based methods, as they provide the most absolute molecular measurements.
Proper sample preparation, including complete dissolution and buffer matching, is critical to prevent common errors that can skew quantification accuracy.
Table of Contents
What Are the Main Peptide Concentration Determination Methods?
How Do You Choose the Right Method for Your Sample?
How Do You Calculate Peptide Molarity From Weight or Absorbance?
What Pre-Measurement Steps Prevent Common Quantification Errors?
How Do You Confirm Results With Orthogonal Methods?
Why Rapidcorebio’s Verification Practices Matter for Quantification
Why Routine Quantitation Discipline Pays Off in the Lab
Sourcing Verified Peptides for Reliable Reference Standards
Sources
FAQ
What Are the Main Peptide Concentration Determination Methods?
Every quantification method measures something slightly different, and that distinction matters more than most protocols admit. Weight-based calculation assumes the mass on your vial label equals pure peptide, which it rarely does. UV spectrophotometry measures light absorbance from specific chemical groups. Colorimetric assays measure a reaction product, not the peptide itself. Amino acid analysis and qNMR measure actual molecular content. Choosing among them means understanding what each number really represents.
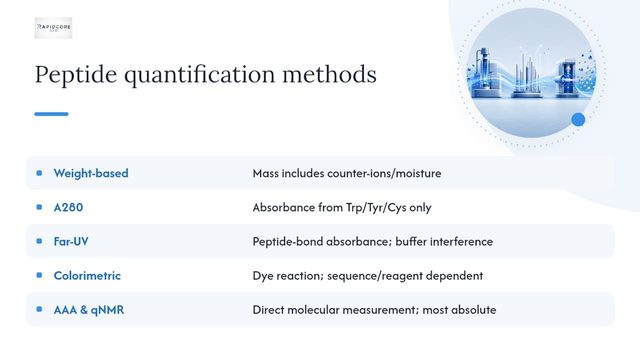
Weight-based calculation starts with the mass on the vial and the volume of solvent added, but that math falls apart if you ignore net peptide content. Lyophilized peptides carry counter-ions (acetate, trifluoroacetate, chloride), residual solvents, and moisture that inflate the weighed mass beyond the actual peptide content. A vendor’s certificate of analysis should report net peptide content separately from purity. Purity tells you how clean the peptide is relative to other peptide-related impurities; net content tells you how much of that weighed powder is peptide at all. Confusing the two is one of the most common quantification errors in peptide research.
A280 spectrophotometry works only when your sequence contains tryptophan, tyrosine, or cystine disulfide bonds, since these are the residues that absorb at 280 nm. You cannot borrow a generic protein extinction coefficient for this. Aromatic residue content and disulfide pairing determine the sequence-specific extinction coefficient, and using a generic value produces concentration errors that compound through every downstream calculation. Peptides lacking Trp, Tyr, or Cys–Cys pairs give little or no usable A280 signal.
Far-UV methods (A205, A214, and the Waddell A215–A225 approach) detect the peptide bond itself rather than side chains, so they apply to nearly any peptide regardless of sequence. The tradeoff is sensitivity to buffer interference, since many common reagents absorb strongly in this same wavelength range.
Colorimetric assays like BCA and epicocconone-based LavaPep detect a dye-peptide reaction rather than the peptide directly. They’re convenient for rough estimates on complex or dilute samples, but sequence dependence and reagent-specific calibration curves make them less reliable for anything approaching an absolute number.
AAA and qNMR hydrolyze or directly measure the sample down to constituent components, delivering the closest thing to an absolute value available in a standard lab workflow. NIST’s survey of quantification reproducibility found HPLC assays calibrated against bulk material as the standard showed the lowest inter-laboratory variability, while qNMR looked promising but hadn’t yet reached routine adoption. Both cost more time and money than a UV read, and that’s the tradeoff you’re weighing.
LC–MS and microfluidic spectrophotometers round out the toolkit for mixtures headed straight into mass spec workflows, where you need MS-ready quantification without consuming your entire sample.
How Do You Choose the Right Method for Your Sample?
The right method depends on four questions you should ask before you touch a cuvette: How accurate does this number need to be? What’s in your sequence? How much material and instrument access do you have? What happens downstream?
Sequence composition drives the first fork in the road. A peptide with tryptophan or tyrosine gives you a usable A280 signal, so calculating its extinction coefficient is often the fastest path to a workable number. A peptide without any aromatic residues or disulfide bonds needs a far-UV method like Waddell instead, since A280 will read near zero regardless of actual concentration.

Sample volume and cleanliness matter just as much as sequence. A crude synthesis mixture with residual salts, scavengers, or coupling reagents will throw off any UV-based read until it’s cleaned up. A precious few microliters of a purified LC–MS fraction calls for a microfluidic spectrophotometer over a standard cuvette instrument, since you can’t afford to sacrifice sample volume for a measurement.
Here’s a practical order of operations:
Check your sequence for Trp, Tyr, or Cys–Cys content to determine whether A280 is viable.
Confirm sample cleanliness. If buffer components or synthesis byproducts are present, plan for desalting or SPE cleanup before any UV read.
Pick your UV method. Use A280 with a calculated extinction coefficient if aromatics are present; use Waddell A215–A225 if they’re not.
Cross-check with a colorimetric assay only if you need a rough estimate and don’t have UV access.
Escalate to AAA or qNMR when you’re establishing a reference standard, validating a new synthesis batch, or resolving a discrepancy between methods.
Use LC–MS-compatible quantification (microfluidic spectrophotometer plus MS-peptide Quant) when your sample is headed straight into a mass spectrometer and volume is limited.
Pro Tip: Run your first few UV readings at two different dilutions. If the absorbance-to-dilution ratio isn’t roughly linear, something else is going on, usually incomplete dissolution or a buffer interference you haven’t accounted for.
How Do You Calculate Peptide Molarity From Weight or Absorbance?
Here’s where the math gets concrete. These are the calculation templates you’ll use in nearly every peptide quantification workflow, whether you’re prepping a stock solution or verifying a vendor’s certificate of analysis.
Correct for net peptide content first. If your vial contains 5 mg of lyophilized peptide and the certificate of analysis lists 78% net peptide content, your actual peptide mass is 5 mg × 0.78 = 3.9 mg. Always pull this figure from the vendor’s certificate of analysis or an amino acid analysis result rather than assuming the vial weight is pure peptide.
Calculate mg/mL from corrected mass and solvent volume. Dissolve that 3.9 mg of net peptide in 2 mL of solvent, and your concentration is 3.9 mg ÷ 2 mL = 1.95 mg/mL.
Convert mg/mL to molarity. Divide mg/mL by the peptide’s molecular weight (in g/mol), which gives you mol/L, then multiply by 1,000,000 to express it in µM. For a peptide with a molecular weight of 1,200 g/mol: 1.95 mg/mL ÷ 1,200 g/mol = 0.001625 mol/L = 1,625 µM.
Apply the Waddell formula for far-UV quantification. The Waddell A215–A225 method calculates concentration as mg/mL = (A215 − A225) × df × 0.144, where df is your dilution factor. Say your undiluted sample reads too high, so you dilute it 1:10 and measure A215 = 0.42 and A225 = 0.11. The calculation runs (0.42 − 0.11) × 10 × 0.144 = 0.446 mg/mL. Absorbance at 215 nm must stay below 0.5 for this formula to hold; if it doesn’t, dilute further and recalculate.
Calculate epsilon280 from sequence for A280 quantification. Extinction coefficient (epsilon280, in M⁻¹cm⁻¹) is built from residue counts: multiply the number of tryptophan residues by 5,500, tyrosine residues by 1,490, and cystine (disulfide) pairs by 125, then sum them. A peptide with one Trp and two Tyr residues gives epsilon280 = 5,500 + (2 × 1,490) = 8,480 M⁻¹cm⁻¹. Using Beer’s Law (A = epsilon × c × l, with path length l typically 1 cm), a measured A280 of 0.35 gives concentration c = 0.35 ÷ 8,480 = 4.13 × 10⁻⁵ M, or 41.3 µM.
Sanity-check the order of magnitude. A stock solution of a small peptide at a few mg/mL should typically land in the hundreds of µM to low millimolar range. If your calculated molarity is off by several orders of magnitude, check your molecular weight units and dilution factor before trusting the result.
What Pre-Measurement Steps Prevent Common Quantification Errors?
Most quantification errors trace back to sample prep, not instrument calibration. A handful of checks before you measure will save you a repeat run later.
Confirm complete dissolution before you trust any reading. Undissolved peptide particulate scatters light and skews absorbance readings unpredictably. Visual inspection catches obvious cases, but the more reliable check is measuring absorbance across two or three dilutions and confirming the response scales linearly. A nonlinear relationship usually means residual solid material or aggregation, not a real concentration difference. The Peptide Reconstitution guide covers dissolution troubleshooting in more depth if you’re working with a difficult sequence.
Match your blank exactly to your sample buffer. Many common lab reagents, from certain salts to organic solvents, absorb strongly in the far-UV range where Waddell and A205/214 methods operate. A blank made of plain water when your sample sits in a phosphate or acetate buffer will read artificially high, since you’re not subtracting the buffer’s own contribution.
Keep absorbance within your instrument’s validated range. For Waddell quantification specifically, A215 needs to stay below 0.5. Above that threshold, the relationship between absorbance and concentration stops being linear, and your calculated mg/mL becomes unreliable regardless of how carefully you did the arithmetic.
Practical steps that reduce errors across the board:
Track your dilution factor at every step, not just the final one, since a lost factor of 10 is the single most common calculation mistake.
Use fresh buffer for your blank, made the same day as your sample buffer, since some reagents degrade or absorb differently over time.
If UV absorbance looks abnormally high or noisy, suspect reagent interference before suspecting your peptide, and consider a desalting or solid-phase extraction cleanup step, covered in the Peptide Sampling Techniques guide.
On microvolume instruments like a NanoDrop, remember that path length is often shorter and more variable than a standard 1 cm cuvette, which shifts your detection limits and requires its own calibration awareness.
Pro Tip: Keep a running log of every dilution factor and blank recipe for a given peptide batch. When a number looks off three weeks later, that log is the fastest way to find out whether the error is in your math or your sample.
How Do You Confirm Results With Orthogonal Methods?
A single UV reading is a good working number, not a verified one. Orthogonal confirmation matters most when you’re setting a reference standard, resolving a discrepancy between two methods, or preparing material for a validated assay.
AAA and qNMR provide absolute quantitation independent of UV assumptions about extinction coefficients, and they’re the appropriate check when your A280 or Waddell numbers disagree with a vendor’s certificate of analysis. Recent RP-LC-MS amino acid analysis methods using certified isotopically labeled amino-acid internal standards now allow absolute quantitation directly from hydrolysates without derivatization, a meaningful simplification over older AAA workflows.
Isotopically labeled internal standards in LC–MS workflows let you spike a known quantity into your sample and back-calculate the endogenous peptide concentration through spike-recovery, a technique that holds up even in complex mixtures. The Isotopically Labeled Peptides guide walks through how these standards function in practice.
Microfluidic spectrophotometers, such as a Lunatic-type instrument, and standard NanoDrop devices both work from small sample volumes, but they differ in dynamic range and throughput. Microfluidic platforms paired with MS-peptide Quant software have demonstrated high linearity (R² above 0.98) for MS-ready peptide mixtures, which matters when you’re normalizing injection amounts across a large sample set.
Report validation metrics, not just a single concentration value, when documenting a new method for your lab: linearity (R²), coefficient of variation across replicates, and limit of detection/quantification. These numbers tell the next researcher whether your method is trustworthy for their sample type, not just yours.
Why Rapidcorebio’s Verification Practices Matter for Quantification
Every concentration calculation starts with an assumption about what’s actually in the vial, which is exactly why the certificate of analysis matters as much as the math that follows it. Rapidcorebio verifies each batch of research peptides with HPLC and mass spectrometry, giving researchers a documented starting point instead of a label they have to take on faith.
That starting point still needs interpretation. A certificate that reports purity without net peptide content, for instance, tells you less than it seems to. The Peptide Certificate of Analysis guide breaks down what each field on a typical COA actually represents and where net content fits into your own weight-based calculations. The Net Peptide Content guide goes deeper into correcting vial weight for counter-ions and residual moisture, a step this article’s worked calculations depend on.
This piece was written with technical review from Adrian K. Solis, drawing on peer-reviewed method literature and NIST’s own survey of quantification reproducibility rather than manufacturer claims alone.
Why Routine Quantitation Discipline Pays Off in the Lab
Accurate concentration determination is one of those steps that looks like overhead until you’re three assays deep and can’t explain why replicate wells disagree. Building a quick QC check, a Waddell read or an A280 calculation, into your standard workflow before every major assay catches errors while they’re still cheap to fix.
The payoff shows up as reduced variability between runs, fewer repeat experiments, and results that actually compare across different weeks or different researchers in the same lab. That consistency is worth the extra five minutes at the bench.
— Adrian K. Solis
Sourcing Verified Peptides for Reliable Reference Standards
Every calculation in this article assumes you know what’s actually in your starting material, and that assumption is only as good as your source. A source providing research-grade peptides with batch-specific HPLC and mass spectrometry verification offers a documented reference point instead of a guess when setting up a standard curve or validating a new assay.
If you’re establishing a new reference standard or troubleshooting a discrepancy between your in-lab UV reading and a vendor spec sheet, start with a verified source rather than compounding uncertainty on top of uncertainty. Check the certificate of analysis for a given batch before you calculate anything, and browse verified research-grade peptides when you need material with documented purity and net content behind it. The research handbook is a useful next stop for terminology and reference material as you build out your own quantification protocols. All products are sold strictly for laboratory research use.
Sources
The calculations and method comparisons in this article draw on peer-reviewed analytical chemistry literature and government laboratory survey data rather than manufacturer claims. For deeper method validation, consult NIST’s survey of peptide quantification reproducibility, the Waddell method reference from UT Health San Antonio, the PMC study on microfluidic MS-ready peptide quantification, and the 2023 RP-UPLC-MRM-MS method for absolute peptide quantitation. Researchers targeting LC–MS workflows may also find value in literature on stable isotope-labeled peptide strategies for targeted quantification.
Simple Peptide Quantification Approach for MS-Based Proteomics Quality Control
Survey of peptide quantification methods and their reproducibility (NIST)
RP-UPLC-MRM-MS method for absolute peptide quantitation (2023)
FAQ
What Does a BCA Assay Actually Tell You?
A BCA assay measures a colorimetric reaction between peptide bonds and a copper-based reagent, giving a rough concentration estimate rather than a direct peptide measurement. It’s sequence-dependent and works best for a fast estimate on a complex sample, not as a reference-grade value.
What Is the Best Free Tool for Calculating Peptide Amounts?
No single free calculator is universally endorsed, since accuracy depends on entering the correct sequence-specific extinction coefficient or net peptide content figure. A basic spreadsheet using the Waddell formula or the A280/Beer’s Law equation, with your own verified inputs, is often more reliable than a generic online calculator with unclear assumptions.
How Do You Know if a Peptide Is High Quality?
Check the certificate of analysis for HPLC purity and mass spectrometry confirmation of identity, along with net peptide content rather than just total vial weight. A detailed COA guide explains what each of these fields should show for a properly verified batch.
How Do You Calculate the Isoelectric Point (pI) of a Peptide?
The isoelectric point is calculated from the pKa values of ionizable side chains and the N- and C-termini in the sequence, typically using the Henderson-Hasselbalch equation across a pH range to find where net charge equals zero. Most researchers use sequence-based software tools for this rather than manual calculation, since it requires iterating across multiple ionizable groups simultaneously.
When Should You Use AAA or qNMR Instead of UV Methods?
Use amino acid analysis or qNMR when you need an absolute reference value, such as when setting a new lab standard or resolving a disagreement between UV-based readings and a vendor specification. Both methods measure actual molecular content rather than relying on assumptions about extinction coefficients or dye reactions.
This article is intended for laboratory research and educational purposes only. All peptides referenced are research compounds not intended for human or animal consumption.
Recommended